Should we account for herd age-profile when benchmarking overall lameness prevalence?
ArticlePosted: March 4, 2026
Whole-herd lameness prevalence is the standard benchmark across UK dairy farming, but it does not account for differences in lactation profile between herds. Because lameness risk nearly triples from first to fourth lactation and beyond, a herd with a higher proportion of older cows will show elevated prevalence even if its management is sound. CattleEye Product Director Nial O’Boyle discusses how lactation-adjusted benchmarking removes this structural bias and allows fairer comparison between farms...
Monitoring and benchmarking herd lameness prevalence has been a mainstay of mobility management in the UK for over 20 years. It has been very successful in engaging and giving the whole industry a focus on improving lameness. Initiatives like Register of Mobility Scorers (RoMS), has provided the structure to enable the supply chain to benchmark and systems like CattleEye to automate mobility monitoring.
Making GB Dairy Cow Lameness Manifesto targets more meaningful
Despite this and world-leading research/innovations from UK universities, Agriculture and Horticulture Development Board (AHDB) and many others say the national (and international) herd prevalence has not made the progress we would all want. The GB Dairy Cow Lameness Manifesto seeks to provide added momentum, with a clear objective:
- To incrementally reduce lameness by at least 10% year-on- year, until at least 95% of all British dairy herds achieve a lameness prevalence of under 5% by 2044.
We could encourage any business or organisation to become signatories if they have not already Manifesto strategies – Ruminant Health & Welfare
How lameness risk changes across lactations
However, after reviewing data from 25 herds (mix of UK, USA and GCC, approx. 50,000 cows) one aspect of prevalence appeared consistent. There was a clear gradient in prevalence per lactation, in the pooled data, risk almost triples from first lactation to fourth plus.
- 11% in first-lactation cows
- 15% in second
- 23% in third
- 30% in fourth lactation and above.
This trajectory is not surprising. Older cows accumulate metabolic strain, claw lesions, structural wear etc but it does raise the question – if lameness differs per lactation and herds differ in their lactation profile, is whole-herd prevalence a fair metric for comparison?
The problem with whole-herd prevalence as a benchmark
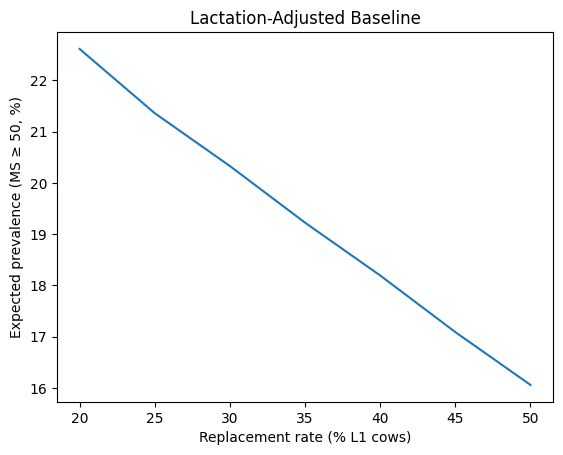
To explore this further, we examined what whole-herd prevalence would look like if biology were held constant and only lactation structure varied. The line above represents that expected prevalence, applying the pooled lactation-specific risks (11%, 15%, 23% and 30%) across typical commercial replacement ranges of lactation. As replacement rate increases and the herd becomes younger, expected whole-herd prevalence predictably falls. Across a normal range of approximately 25% to 50% replacement, the difference in expected lameness is around five percentage points, reflecting lactation profile rather than management. In practical terms, two herds with similar foot health and management could differ by several percentage points in whole-herd prevalence purely because one herd is structurally older.
What lactation-adjusted lameness data shows
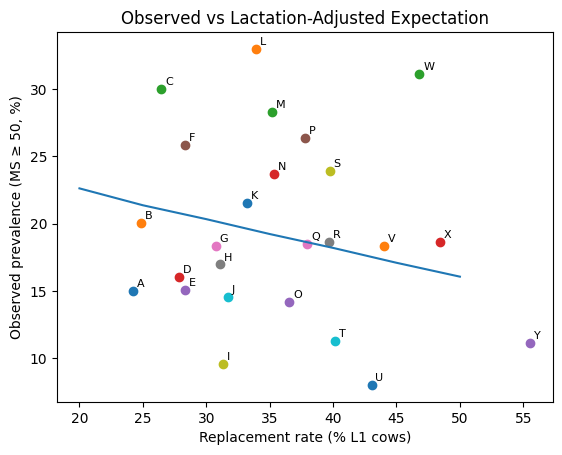
As can be seen from the graph above, lactation profile explains only a small part of the variation between farms (each letter represents a farm). While lactation profile shifts the baseline prevalence by a few percentage points, the variation between herds is far more likely to reflect management, facilities, trimming strategy, cow flow, nutrition, genetics and overall environment rather than lactation profile alone. Adjusting for lactation will not eliminate differences but it could remove one layer of structural noise, allowing a clearer view of where genuine performance differences exist.
Whole-herd prevalence has undoubtedly helped focus attention and drive accountability, and it remains a valuable and practical metric. But could we refine it further?
What lactation-adjusted benchmarking could change
Lactation-adjusted benchmarking might allow fairer comparison between herds with different age profiles and help separate structural effects from true biological performance. It is also worth recognising that lactation profile is not random; it is influenced by management decisions, genetics, TB pressure, supply-chain requirements and overall system design.
As these factors continue to shape longevity, resilience and replacement strategy, herd age structure itself increasingly reflects breeding and strategic decisions. A clearer understanding of how lactation profile interacts with lameness prevalence may therefore become even more relevant in the years ahead.
Nial previously wrote about the resilience of modern dairy cows and their capacity to live as long (and as healthily) as we would like them to – please find that article here.